Address to Burns

It’s Burns Night tonight. I’ve dredged this up from my files for 2002:

Address to Burns

Fair fa’ your honest, sonsie face
Great poet o’the chieftain race
Aboon them a’ ye tak your place:
Wordsworth, Shak’speare, Scott.
Yon Sassenachs cannae cut your pace –
Ah love them no’ a jot.

In Alloway ye wis a bairn
Your pa a gairdner in Ayr’n
Ye met your first love there:
Nelly wis her name.
Tae paper thus ye put your pen
Tae give her fame.

Ye exercised your hurdies well
Intae your welcome airms there fell
Muckle lassies in your spell:
Eight bastards sired.
An’ then ye married: jist as well –
Ye must hae been tired!

And so ye clapped your pen once mair
Intae your walie nieve, and there
Wis wroght sic vairses fair
As ony man could mak –
Sae far aboon the skinkin’ ware
O’Coleridge and Blake.

An’ yet, as every rustic must
Or noble aye, ye came tae dust
An’ six feet under ye wis trussed
Frae your feet tae your heid.
But as I’m English, I’m not fussed:
Your doggerel is ‘deid’.

Burns? Pah! In England we should celebrate Browning night on 7th May!

What gets you Twitter followers? Part 3 of 3: content

Here’s the final part of my short series on mining data on around 50,000 Twitter accounts, as recorded by Twanalyst. Previously:

  • Part one looked at user profiles. Generally, the more you fill out your profile (description, avatar, background image etc), there seems to be a correlation with increased number of followers; and high-status description terms (‘entrepreneur’, ‘author’, ‘speaker’ etc) perform better than, er, low status ones (‘student’, ‘nerd’ etc).
  • Part two discussed friends counts, and frequency of tweeting. There is an unsurprisingly close correlation between the number of friends you have and the number of followers; and you’re better off tweeting less than 30 times a day to avoid putting off followers. (Remembering always that correlation doesn’t mean causation, fact fans!)

Twanalyst also records data on the ‘type’ of tweets people write. It divides them into five categories:

  • Replies/mentions – anything beginning with a @ goes into this pot (mean 35% median 34%)
  • Retweets – ie simply retweeting others’ content (with RT as the flag) (mean 5% median 1%)
  • Links – tweets that contain web links pointing elsewhere (mean 16% median 9%)
  • Hashtags – tweets that use a hashtag to participate in some group activity (mean 3% median 0%)
  • Everything else – ie just normal tweets that aren’t any of the above (what people had for lunch, random witticisms, or whatever) (mean 41% median 37%)

Obviously in reality these categories aren’t so discrete, but let’s live with that and assume everything falls into one or another. Twanalyst records each as a percentage of total tweeting output (it analyses the most recent 200 tweets).

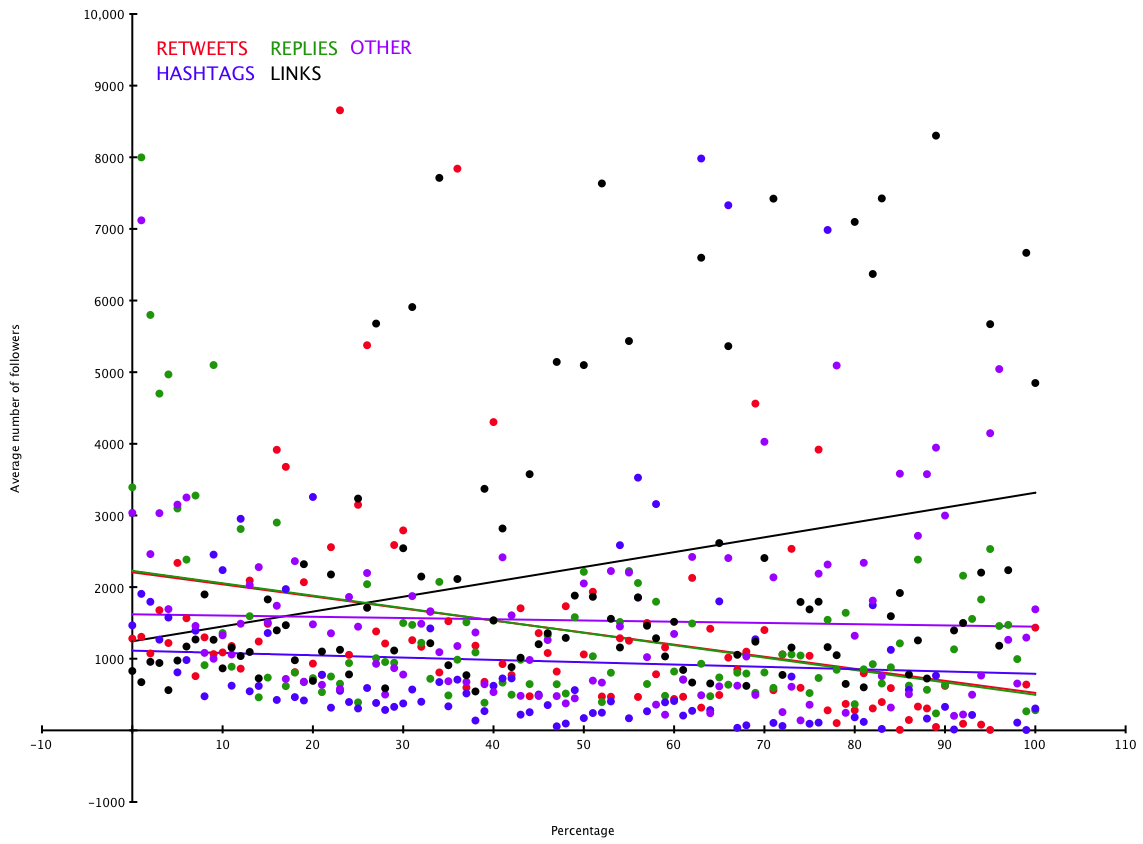
Expressed as a graph of these percentages against average follower counts for each percentage point (I’ve chopped off a few extreme values due to accounts with hundreds of thousands of followers):

Tweet content/followers

The ‘lines of best fit’ are not hugely precise, but in broadly speaking it seems that there is a slight correlation between tweeting links and higher follower counts – people are interested in accounts which gather interesting stuff from elsewhere and tweet about it. The other values don’t really have any strong correlations.

One final analysis. Twanalyst also calculates a user’s Automated Readability Index – ie a rough measure of the simplicity or complexity of the language they use. A figure of between 6 and 12 represents ‘normal’ prose: below is simplistic and much above enters the realm of obscurantism. (It should be noted though that because tweets often contain links, odd hashtags and so on, the ARI figure is of necessity a bit vague.) Here’s ARI (chopped off at 50, and ignoring twitter accounts with more than 100,000 followers) measured against average follower counts for each data point:

readability

Not much to add here, except the obvious: very simple and very complex writing styles seem to put people off (apart from an odd blip at ARI=48), but a reasonably level of complexity may actually be popular. Or it may all be coincidence. Over and out!

What gets you Twitter followers? Part 2: friends and frequencies

I’ve been analysing data from 50000 Twitter accounts, recorded by my Twanalyst tool (tracks your Twitter stats over time, and analyses your tweeting style and personality). In Part 1, I looked at how people’s profiles might correlate with their number of followers, and a few trends emerged.

This time I’ve been looking at the relationship between follower counts and the following:

  • Number of friends
  • Time since joining Twitter
  • Number of tweets written
  • Average number of tweets written per day

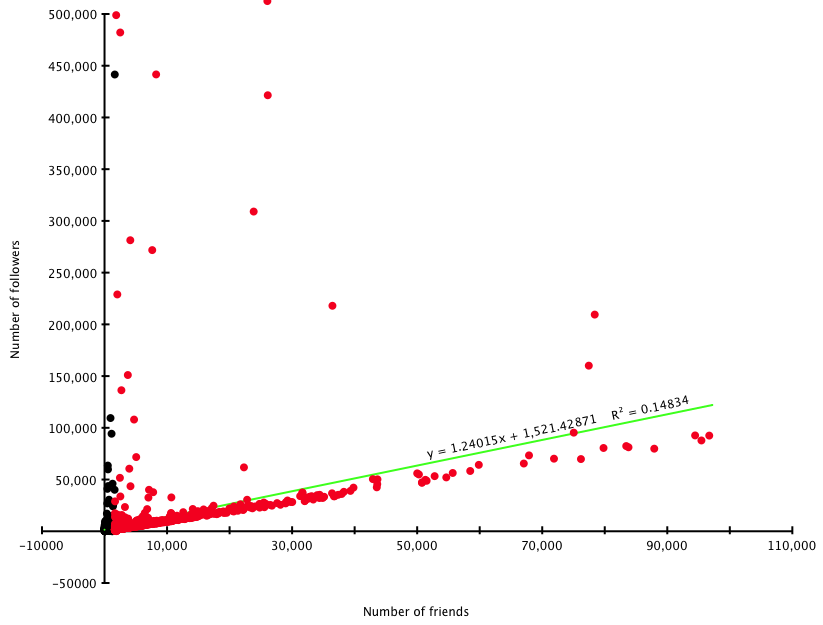
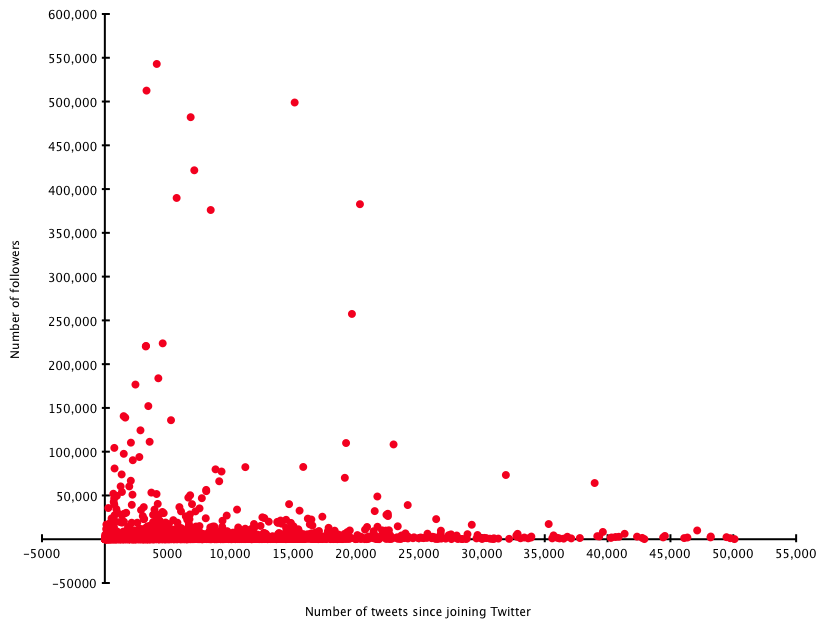
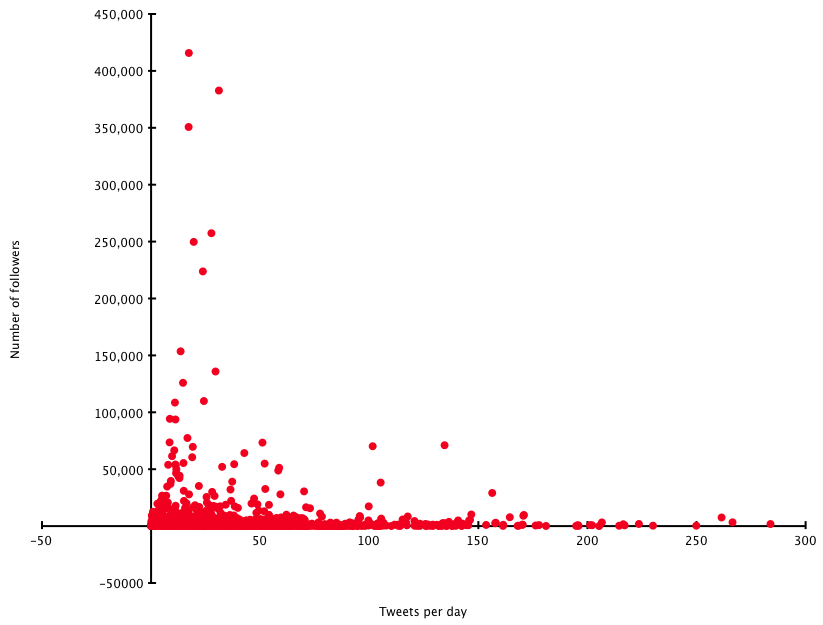
In each graph below, the X-axis shows the above data, with follower counts on the Y axis. The Y figures are averages taken for each value of X.

Friends

Friends/followers
Friends/followers

The green line is the estimated line of best fit by OmniGraphSketcher (excellent Mac graphing program) – though it seems slightly generous. (I’ve cut friends off at 100000, as the few data points above that are so high that the rest of the data becomes unclear.) Roughly speaking, and unsurprisingly, there’s a one-to-one relationship between friends and followers. Want followers? Make friends.

Time

Days/followers
Days/followers

Obviously you need to have been on Twitter for a little time to get followers – but overall there isn’t really any strong correlation noticeable between how long you’ve been using it and how many followers you have. It must be what you do with Twitter that matters, rather than simply Being There.

Tweets

Tweets/followers
Tweets/followers

This doesn’t seem to show much, either. What might be helpful is to measure this against time…

Rate

Tweet rate/followers

When you measure the average number of tweets per day (since joining Twitter, and I’ve ignored a handful of rates over 300/day), a broad message comes across that you’re best of tweeting up to around 30 times a day – above that, and you risk putting people off. Again, this isn’t exactly surprising.

So there aren’t really any profound observations here, sorry: the data seems to corroborate common sense.

In the third and final part of this series, next week, I’ll see if there are any correlations between tweeting style (as recorded by Twanalyst – number of retweets, posting of links, how much you reply to other people etc) and follower counts. Thanks for listening!

PS: I’m indebted to the UNIX BASH Scripting blog for an awk script that helped crunch this data.

What gets you Twitter followers? Part 1: profile usage

Running Twanalyst has given me access to large amounts of data, which I’m slightly-too-addicted to crunching. Inspired by this post at Social Media Today, which analyses the popularity of Twitter users according to the words they use in their tweets, I realised I have a large database of people’s Twitter biographies. Do the words people use in their self-penned descriptions have any influence on the number of people who follow them? (Well, presumably yes, given that ‘sod off and don’t follow me’ would be an ill-advised way of getting a large following.) But which words?

I’ll come back to that – first, some more general data.

I analysed around 50000 accounts with data stored at Twanalyst. The average number of followers was 1449. Some gleanings:

  • 66% of people gave a URL with their Twitter biography – they averaged 1984 followers, whereas those who didn’t give a URL averaged only 429
  • 50% of people use a background picture of some kind – they averaged 2196 followers, whereas those who didn’t use one averaged only 707 (more on the pictures in a moment)
  • 97% of people use an avatar (ie little icon) with their Twitter account – they average 1485 followers, whereas those who don’t average just 144
  • 80% of people provided a biography or description – they averaged 1541 followers, whereas those who didn’t averaged 183.

Of those who use a background picture, by the way, the most popular ones of those provided by Twitter are themes 1,2,5,9 and 10 (all with > 1000 users – 1 has > 10000) – but only theme 15 took the follower count above average, and that’s probably just because the Hollywood actor Neil Patrick Harris (with around 130,000 followers) uses it! (I haven’t mined whether using your own background picture is better than using one provided by Twitter, though the above data implies that.)

Back to the words.

I got rid of stop words, then mined the biographies for words (mostly nouns, plus a few selected adjectives) which describe someone’s role in life (whether career-based, such as ‘programmer’, or personal such as ‘wife’). The top 10 words (by popularity) were: geek, writer, student, developer, lover, father/dad, mother/mom, blogger, photographer and designer. I only looked at words used by 1% of by sample set or more.

The only words in the top 50 or so terms associated with above average follower counts were: blogger (2323 – remember the average was 1449), artist (1692), girl (1711), fan (1712), author (3681), entrepreneur (2663), director (1683), marketer (2541), expert (4273) and singer (2300). Some more details picked out (all figures are average number of followers where the description uses the term in question):

  • The worst terms (all with follower averages below 400) were student, developer, nerd, engineer and programmer – go figure! (Geek came in at 675, so also pretty low.)
  • Home life and gender: father/dad gets 845, but mother/mom gets 1202; girl gets 1711 but boy only 518; husband gets 868, wife 740; oddly the generic guy gets 1380.
  • Expertise: amateur gets 477, expert gets 4273 (but professional only has 969)
  • Although author gets 3681, writer gets only 906 – maybe people see ‘author’ as more established, and writer as more wannabe? (Editor fares averagely with 1409.)
  • Although singer gets 2300, musician only gets 585.

I can’t claim using the right words is a guarantee of a high follower count, of course – that must relate to what you write as well as who you are; but there do seem to be some general trends (eg expertise rates high, and nobody wants to read what students have to say!). Oh, and if you use the phrase follow me in your bio, the average follower count is 2418…

Another time I’ll mine some data about how people’s Twitter behaviour (eg how much they follow others, how often they tweet, what sort of tweets they write…) relates to follower counts too. Watch out for Part 2 some time in the next few weeks. If I find any more time (ha!) I might create a tool where you can look up terms yourself.

(Oh, and you can follow me at @hatmandu, of course!)

Edit (Part 1A!)

Here’s another angle on the same data set. Out of 39975 profiles which include descriptions, we find the following:

  • 1.5% have 10,000 or more followers. The top 10 ‘role-defining’ terms people in this subset use are: blogger (4.6%) author founder speaker writer entrepreneur host father/dad director marketer (2.2%)
  • 10.0% have 1,000 or more followers but less than 10,000. The top 10 terms here are: blogger (7.7%) writer geek father/dad entrepreneur author designer lover mother/mom founder (3.0%)
  • 44.2% have 100 or more followers but less than 1,000. The top 10 terms are: geek (5.7%) writer blogger designer student lover developer father/dad mother/mom photographer (2.7%)
  • 44.3% have less than 100 followers. The top 10 terms are: student (2.7%) geek writer designer developer lover guy fan mother/mom photographer (0.8%).

It’s noticeable that writer appears at all levels – from the hugely successful to the obscure and aspiring, just like in real life. It’s hard not to spot that the very top end accounts are full of founders and speakers etc. And the bottom: those pesky students again. I’m surprised blogger fares so well – but perhaps people like bloggers who write about a specialist subject?

Part II next week!

What’s it all about, Alfie

I’ve just launched a new tool at Hatmandu.net, a text content and keyword analyser – in theory useful for search engine optimisation, but also to get the general gist of a text.From the notes:

This text content and keyword analyser is intended to give a more precise indication of a text’s most important words than other tools available. Most keyword analysers use simple word frequency (which is also shown here anyway), but that doesn’t relate the specific text to the language in general – common terms such as ‘people’ and ‘time’, for example, appear in many documents, but do not necessarily indicate the essence of the particular text being analysed. This analyser uses the TF-IDF statistical method to relate the frequencies of words in the specific text to their general frequencies in the British National Corpus. I am indebted to Adam Kilgarriff‘s version of the BNC, which I have adapted considerably for this tool. This analyser mainly uses the nouns in the BNC, on the basis that these are the parts of speech that best indicate the subject matter of a text. (At some point I hope to produce a version using an American English corpus, though I’d be surprised if the results were very different.)

It works with Twitter accounts (though it only reads the last 200 tweets, which may not form a usefully large body of text), and URLs where my humble scraping tool is able to extract the text successfully – most useful is the ‘paste text’ field, which will accept up to 1Mb of text (about 200,000 words) – so will analyse entire books if desired. Livejournal users can enter their URL (http://username.livejournal.com) assuming their account is public.

It’s a bit experimental at the moment, but hopefully might migrate from ‘possibly fun’ to ‘possibly useful’ in due course!

A new look at the publisher’s lunch

As usual, everyone’s talking about how publishing can survive, and how to make money on the internet. Paul Graham has written an excellent essay, Post-Medium Publishing, where he observes that it is wrong to think publishers sell ‘content’ – rather, they sell a means of distribution, and prices are dictated by that (ie, historically, the price of paper and printing) – if t’were otherwise, we’d all pay vastly different sums depending on the quality of the content. And we don’t. Bottom line: “Whoever controls the device sets the terms.” Prospect Magazine, commenting on Graham, also reminds us that we’ve seen all this before, back in Shakespeare’s time.

Meanwhile, Steve Outing warns that ‘Your news content is worth zero to digital consumers’, and that money is again in delivery systems such as neato iPhone apps. (He quaintly goes on to suggest micro-rewards – tip jars 2.0, I guess.) Jeff Reifman has weighed in against Outing saying ‘Micropayments could save journalism’. It’s hard to see how: if the headline writers are any good, the headline is where the news is – the rest is elaboration. I get my news from a few simple sources, all of them essentially ‘headlines’:

  • A few snatched moment’s of Radio 4’s Today programme between bouts of baby care – I really just get the 7am headlines
  • RSS feeds from the BBC and the Guardian on my iGoogle page – I’ll occasionally click through if I want the detail or I’m piqued by something
  • Twitter feeds

I buy one newspaper a week: the Saturday Guardian. I do read the news in it – but almost invariably I’ve seen it the day before on the web. I like it for the columnists, the features, the magazine, basically as a ritual entertainment to accompany a cup of tea. My wife just does the crossword. The physical newspaper, in other words, has become an entertainment channel rather than a news one.

Micropayments? I can’t see myself paying for news stories. Features… maybe, if they’re really going to interest me. Academic papers: possibly, if I’m researching something. That said, I did make one micropayment this week: we were planning to buy a new car seat for the baby, and only one place, Which, has a decent, up-to-date review of best buys, focusing on safety (ie there’s an emotive imperative here – and the possibility of saving money, I guess). They charge £1 for a trial subscription – but then sting you with monthly payments several times that. You can cancel any time, so I will cancel straight away. It’s very annoying: I just want one article, which I probably would have paid £5 for, simply because it’s not possible to get this quality information elsewhere. I subscribed because I’m bloody minded enough to remember to unsubscribe – though of course their business model partly relies on people forgetting, or being sufficiently charmed by the dull magazine you get in the mail.

Paul Graham says that the only kind of information people will pay for is that “they think they can make money from” – I’d add that saving money (assuming more is saved than the information costs!) might be a motive, and niche issues such as the baby safety report I mentioned.

Graham reminds us, as people like Chris Anderson have done before, that something else people will pay for is live entertainment. I wonder if this connects to another constraint upon pricing for publishing models: it’s noticeable that novels, DVD rentals, cinema visits, CD albums, all generally fall within the £5 to £15 range: people will only pay so much for entertainment that they know can be reproduced. Live entertainment, such as a theatre show, opera, music gigs and a decent meal at a good restaurant, is more of a one-off experience, and commands more value. In his excellent book 59 Seconds, Richard Wiseman points to research showing that people’s happiness is improved significantly more by experiences than by products. There’s no such thing as retail therapy.

Again and again I come back, too, to the feeling that modern content producers – writers in particular – have unrealistic expectations of fame and fortune. Most people don’t want their content, and won’t pay much for it even if they do. As Prospect says, we’ve gone back to a pre-Romantic time (I’m thinking of poets and gentleman publishers such as John Murray here, which is where the modern author-publisher dream of the last 200 years began) where writers have to work hard, diversify, hawk their products themselves, and not just sit back and expect a publisher (whose grip of the medium is now somewhat buttery) to make them millions. The Dan Browns and J K Rowlings are the lucky exceptions.

I’m a writer myself, so it’s not like I don’t have an interest in these issues – but I just write to commission, content I know someone seems to want, rather than trying to sell my own ideas, as the latter is so much hard work (obviously I thank my stars for those commissions – and make most of my money by doing design work anyway – ie making vessels for others’ content). Whatever ideas I have (mostly daft, I admit) I give away for free, often at this website.

Perhaps the answer lies in Kevin Kelly’s 1000 True Fans argument: build a core, devoted audience – if your stuff is good enough (and has a bit of luck and a fair wind), there will be some people at least who will go to your every gig, buy every T-shirt, read every book. If you can’t find 1000 true fans… maybe it’s time to be honest and admit the world isn’t knocking at your door. Do something for free. See what happens. Oh, and go out for a nice meal: it will make you happy.

Edit: After a challenge on Twitter to crowdsource payment for an article, you can now pay micropayments to get me to write an article on ‘The Modern Ninja’! I can’t lose: if not enough money is raised, it proves content isn’t worth much to people (well, er, my content…); if it is, I get a paid commission! (Oh, and if less than $300 is raised, I’ll refund your money folks!)
Fighting the day job

Wow. My Twitter personality test site, Twanalyst, has been used 150,000 times since I launched it just four days ago! It’s all pretty overwhelming, especially as I’m  trying to concentrate on a shedload of ordinary work at the moment… Anyway, thanks to everyone who’s used it and helped spread the word.

I’m genuinely working on new features for it, and in fact although the personality thing is a bit of fun, I think the site will have serious uses to give it longer-term appeal. For one thing, it’s useful to see stats and a user profile all on one page anyway; in future I want users to see how their stats have changed over time. I’m also working on a system to suggest relevant users for people to follow. If you have more ideas, do let me know.

The author did it

There’s an interesting article about G K Chesterton in the latest New Yorker (the article’s not online yet), which mentions in passing that GKC ‘must have influenced’ Borges – indeed he did. It sent me ferreting off to find some of the essays where Borges wrote about him, and I found one I hadn’t come across before, ‘The Labyrinths of the Detective Story and Chesterton’.

Anyway, what caught my eye was Borges listing what he took to be the rules of classic detective fiction. Here they are (his words in italics, my comments afterwards):

A. A discretional limit of six characters.
B. The declaration of all the terms of the problem. This is basically Dorothy L Sayers’ ‘fair play’ rule – I’m sure I saw an essay of hers with a list of principles once, but I can’t track it down.
C. An avaricious economy of means. I’m not totally certain what he’s on about here (he only gives counterexamples, eg Conan Doyle regularly breaks B), though I think there’s a tone of Occam’s razor about it.
D. The priority of how over who. ie what happened is more interesting to deduce than who actually did it.
E. A reticence concerning death. (He adds that detective fiction’s “glacial muses are hygieve, fallacy and order”. I think he means it should be an elegant puzzle rather than a gore-fest.
F. A solution that is both necessary and marvellous. There’s only one solution, which makes the reader boggle – but has no recourse to the supernatural. Chesterton’s Father Brown is his model.

That was written in 1935 – only a few years after Ronald Knox came up with his ten commandments for detective fiction (1929) and SS Van Dine formulated his twenty rules (1929). (Side note to self: ooh, I must track down The Sins of Father Knox.)

Anyway, er yeah, not sure why I’m posting this – just interested me. I wonder if there are similar principles that make games work?

Will this do?

Five years on from the Personality Declaration Act 2009, we are in a position to evaluate the indubitable changes it has wrought on society.

A reminder of the background to the legislation – which itself obliges me at this point to declare my red status. Towards the end of 2008, the general populace was growing restless against the use of call centres for businesses to manage their customer relations. There was also a rising tide of complaints against shop floor staff in many retail outlets having no clear interest in or knowledge of the products they were selling (in the cases where they had not been replaced by electronic information points and automated tills).

In a White Paper, communications analyst James McCully proposed that customer service, from both sides of the fence, would be rendered much more effective if the customer were able to determine the level of sincerity of the salesperson or support operative and their personal investment in the matter in hand. He further proposed the use of Myers-Briggs Type Indicators, then still in vogue with human resources professionals, and ran trials in a number of large utility companies where software was used to determine the broad emotional nature of a calling customer (their emotional state was indicated by detecting stress patterns in the voice). The operative then appointed to handle the enquiry was chosen according to their own MTBI profile and how likely it was that they could help the customer (or get rid of them) without further emotional escalation.

To everyone’s surprise, the experiment was generally successful in terms of customer retention – but in practice around 80% of the work was allocated to only 20% of the customer service operatives. Only those with certain personality traits were likely to achieve a positive outcome.

The reader is likely to recall the next stage, a radical simplification of this process where all workers in a public-facing capacity – whether in person, online or as a skypist – were obliged to declare their ‘enthusiasm’, with the use of a statement such as ‘I am obliged to tell you I am personally invested in this company/product’, or its counterpart ‘NOT personally invested’. As with the MBTI experiment, the ratio of the former to the latter was something in the region of four to one. However, the new system threw up successful outcomes, even with the operatives ‘not invested’.

The simple reason was that customers could relate to an operative ‘just doing their job’ (as many were in the same situation in their own workplace) and forgive the lack of interest. To start with there were headlines along the lines of ‘STAFF URGED NOT TO BE BOVVERED’, but when the policy was enshrined in legislation, the journalists themselves were obliged to declare their motivation or lack thereof, and the threat of hypocrisy soon ironed out controversy.

The further simplification in 2012 of this system into a ‘traffic light’ system of ‘green’ and ‘red’ status (for enthusiasm or lack of it respectively) was even more popular and avoided the unwieldy jargon of ‘personal investment’ – although some foreign visitors for the Olympic Games were no doubt somewhat baffled.

Although ‘red’ staff achieved higher levels of customer satisfaction than hitherto, naturally the ‘greens’ remained more popular where detailed information or assistance was required, and they began to attract higher salaries. The occasional cases where members of the red group attempted to fake a green personality were soon weeded out with advances in the burgeoning field of neurorecruitment. Whether the minority of highly paid, ever-smiling and persistently helpful workers retains this popularity is for the future to tell.

This article was written largely with the assistance of Wal*Martopedia, “the free encyclopedia anyone green can edit” (TM). It took 20 minutes to compile and I have been paid 30 euros.