Address to Burns

It’s Burns Night tonight. I’ve dredged this up from my files for 2002:

Address to Burns

Fair fa’ your honest, sonsie face
Great poet o’the chieftain race
Aboon them a’ ye tak your place:
Wordsworth, Shak’speare, Scott.
Yon Sassenachs cannae cut your pace –
Ah love them no’ a jot.

In Alloway ye wis a bairn
Your pa a gairdner in Ayr’n
Ye met your first love there:
Nelly wis her name.
Tae paper thus ye put your pen
Tae give her fame.

Ye exercised your hurdies well
Intae your welcome airms there fell
Muckle lassies in your spell:
Eight bastards sired.
An’ then ye married: jist as well –
Ye must hae been tired!

And so ye clapped your pen once mair
Intae your walie nieve, and there
Wis wroght sic vairses fair
As ony man could mak –
Sae far aboon the skinkin’ ware
O’Coleridge and Blake.

An’ yet, as every rustic must
Or noble aye, ye came tae dust
An’ six feet under ye wis trussed
Frae your feet tae your heid.
But as I’m English, I’m not fussed:
Your doggerel is ‘deid’.

Burns? Pah! In England we should celebrate Browning night on 7th May!

What gets you Twitter followers? Part 3 of 3: content

Here’s the final part of my short series on mining data on around 50,000 Twitter accounts, as recorded by Twanalyst. Previously:

  • Part one looked at user profiles. Generally, the more you fill out your profile (description, avatar, background image etc), there seems to be a correlation with increased number of followers; and high-status description terms (‘entrepreneur’, ‘author’, ‘speaker’ etc) perform better than, er, low status ones (‘student’, ‘nerd’ etc).
  • Part two discussed friends counts, and frequency of tweeting. There is an unsurprisingly close correlation between the number of friends you have and the number of followers; and you’re better off tweeting less than 30 times a day to avoid putting off followers. (Remembering always that correlation doesn’t mean causation, fact fans!)

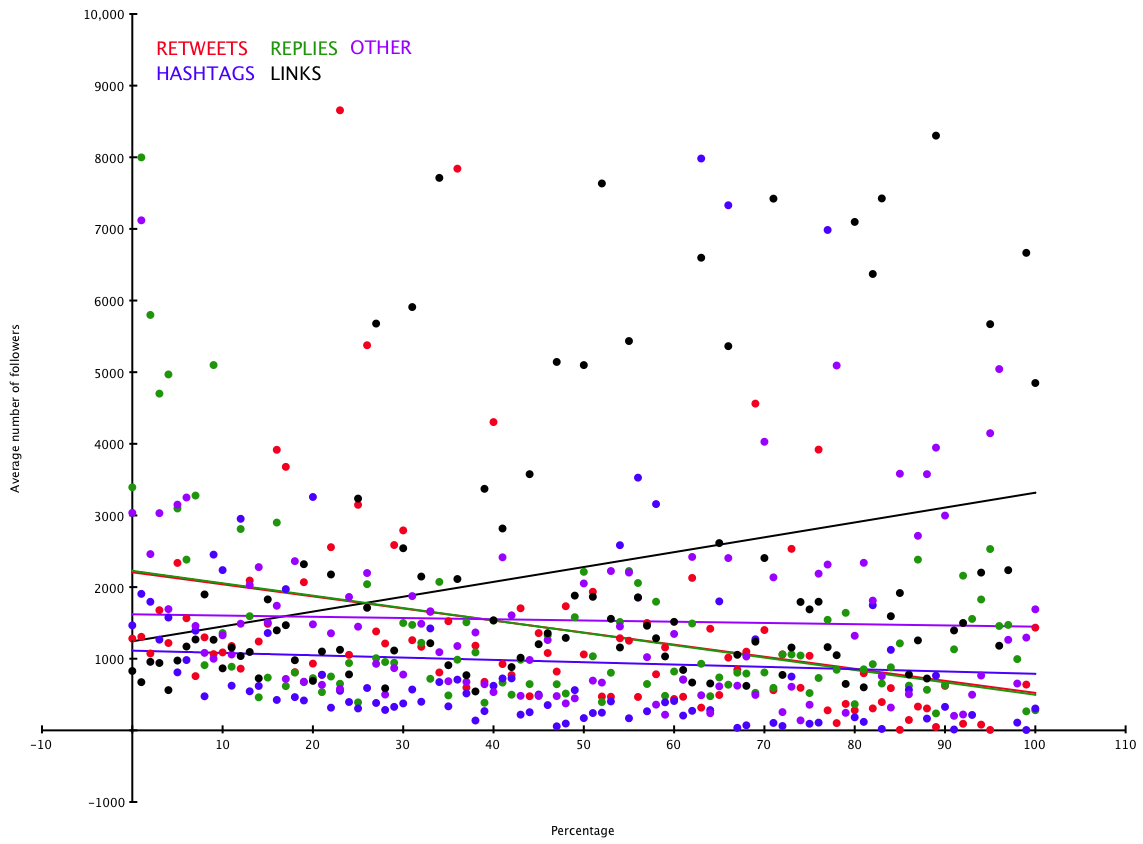
Twanalyst also records data on the ‘type’ of tweets people write. It divides them into five categories:

  • Replies/mentions – anything beginning with a @ goes into this pot (mean 35% median 34%)
  • Retweets – ie simply retweeting others’ content (with RT as the flag) (mean 5% median 1%)
  • Links – tweets that contain web links pointing elsewhere (mean 16% median 9%)
  • Hashtags – tweets that use a hashtag to participate in some group activity (mean 3% median 0%)
  • Everything else – ie just normal tweets that aren’t any of the above (what people had for lunch, random witticisms, or whatever) (mean 41% median 37%)

Obviously in reality these categories aren’t so discrete, but let’s live with that and assume everything falls into one or another. Twanalyst records each as a percentage of total tweeting output (it analyses the most recent 200 tweets).

Expressed as a graph of these percentages against average follower counts for each percentage point (I’ve chopped off a few extreme values due to accounts with hundreds of thousands of followers):

Tweet content/followers

The ‘lines of best fit’ are not hugely precise, but in broadly speaking it seems that there is a slight correlation between tweeting links and higher follower counts – people are interested in accounts which gather interesting stuff from elsewhere and tweet about it. The other values don’t really have any strong correlations.

One final analysis. Twanalyst also calculates a user’s Automated Readability Index – ie a rough measure of the simplicity or complexity of the language they use. A figure of between 6 and 12 represents ‘normal’ prose: below is simplistic and much above enters the realm of obscurantism. (It should be noted though that because tweets often contain links, odd hashtags and so on, the ARI figure is of necessity a bit vague.) Here’s ARI (chopped off at 50, and ignoring twitter accounts with more than 100,000 followers) measured against average follower counts for each data point:

readability

Not much to add here, except the obvious: very simple and very complex writing styles seem to put people off (apart from an odd blip at ARI=48), but a reasonably level of complexity may actually be popular. Or it may all be coincidence. Over and out!

Simple methods get my vote

For the last decade I’ve been following the fascinating work of Gerd Gigerenzer and colleagues (especially Dan Goldstein) – as briefly as I can state it, he has identified a number of very simple heuristics which outperform far more complex models for decision-making processes or making predictions about certain kinds of data (this stuff has partly inspired my Feweristics project). The most accessible explanation of all this is in his book Gut Feelings, where he explains things such as the recognition heuristic, and how it can be used to predict the winner of Wimbledon, or build a stock market portfolio that outperforms many experts, and so on.

Now two researchers, inspired by Goldstein and Gigerenzer’s ‘take-the-best heuristic’ have applied the less-information-beats-more methodology to the US elections since 1972. You can read their paper, Predicting elections from the most important issue facing the country (PDF – I found it via Decision Science News, the work of GG’s collaborator Dan Goldstein), though the bare bones as follows.

In the abstract, authors Andreas Graefe and J Scott Armstrong say that their simple model, called PollyMIP, “correctly predicted the winner of the  popular vote in 97% of all forecasts. For the last six elections, it yielded a higher number of correct  predictions of the election winner than the Iowa Electronic Markets”. Basically, they used a database of pre-election polls to identify what voters thought was the single most important issue each time (this varied over time before the election, in some cases more than others), then used the same database to pull out poll results for which of the two candidates (ie Democrat or Republican) they believed would deal with that issue best (they looked at all polls up to 100 days before the election). In passing, they corroborated other research that the incumbent party always starts with an advantage. (The authors note in their paper: “In the real world, people usually have to make decisions under the constraints of limited information and time, which is why models of rational choice often fail in explaining behaviour.”)

In full, their PollyMIP heuristic works thus (taken verbatim from their appendix):

Step 1 (identifying the most important problem)
Search rule: Look up last available poll on the most important problem facing the country; sort problems in the order of importance.
Stopping rule: Stop search if there is a single most important problem. If two or more problems are of similar importance, average their importance with the results from the most recent previously published poll until a problem is identified as the single most important.

Step 2 (obtaining voter support for candidates on most important problem)
Search rule: Look up polls that obtained voter support on the problem identified in step 1.
Stopping rule: Stop search if there are one or more polls available. Average voter support for each candidate and calculate the two-­party shares of the incumbent. Move to step 3.
If no polls are available and the most important problem (as identified in step 1) is different from the previous day, move to step 2.A. Otherwise move to step 2.B.

2.A (most important problem different to the day before)
Stopping rule: Take the incumbent’s two party share of voter support from the last available poll on the most important problem. Move to step 3.

2.B (most important problem similar to the day before)
Stopping rule: Take the PollyMIP score (see step 3) from the previous day. Move to step 3.

Step 3 (determining election winner)
Decision rule: Average the incumbent’s two-­‐party share of voter support for the last three days, which is referred to as the PollyMIP score. If the PollyMIP score is above 50%, predict the incumbent to win. If it is below 50%, predict the challenger to win. Otherwise, predict a tie.

Or, more briefly: “(1) Identify the  problem seen as most important by voters, (2) calculate the two-­party shares of voter support for the  candidates on this problem and average them for the last three days, and (3) predict the candidate with the higher voter support to win the popular vote.

Not bad for predicting election results 97% of the time. I’d love to see whether this would work for Britain’s elections, too. (They used the iPOLL databank – anyone know if there’s an equivalent for the UK?)

What gets you Twitter followers? Part 2: friends and frequencies

I’ve been analysing data from 50000 Twitter accounts, recorded by my Twanalyst tool (tracks your Twitter stats over time, and analyses your tweeting style and personality). In Part 1, I looked at how people’s profiles might correlate with their number of followers, and a few trends emerged.

This time I’ve been looking at the relationship between follower counts and the following:

  • Number of friends
  • Time since joining Twitter
  • Number of tweets written
  • Average number of tweets written per day

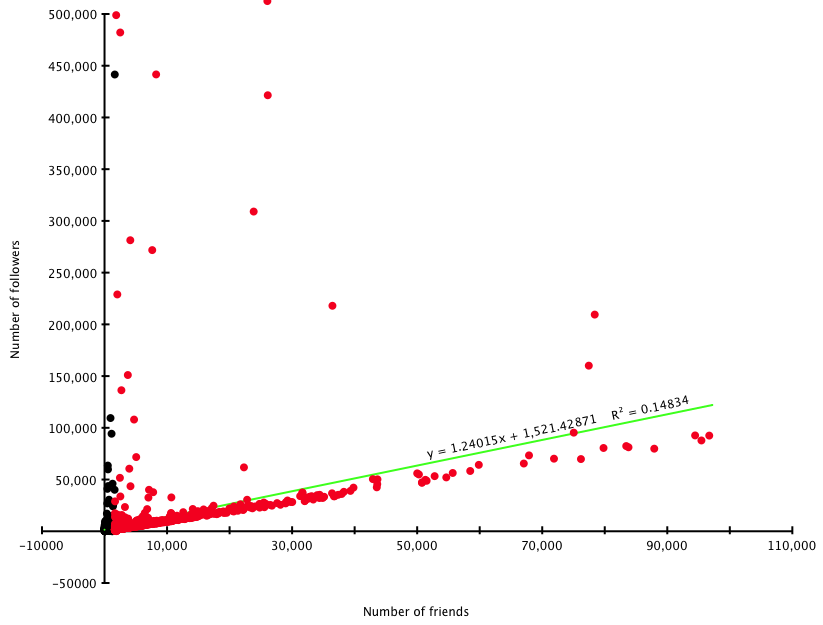
In each graph below, the X-axis shows the above data, with follower counts on the Y axis. The Y figures are averages taken for each value of X.

Friends

Friends/followers
Friends/followers

The green line is the estimated line of best fit by OmniGraphSketcher (excellent Mac graphing program) – though it seems slightly generous. (I’ve cut friends off at 100000, as the few data points above that are so high that the rest of the data becomes unclear.) Roughly speaking, and unsurprisingly, there’s a one-to-one relationship between friends and followers. Want followers? Make friends.

Time

Days/followers
Days/followers

Obviously you need to have been on Twitter for a little time to get followers – but overall there isn’t really any strong correlation noticeable between how long you’ve been using it and how many followers you have. It must be what you do with Twitter that matters, rather than simply Being There.

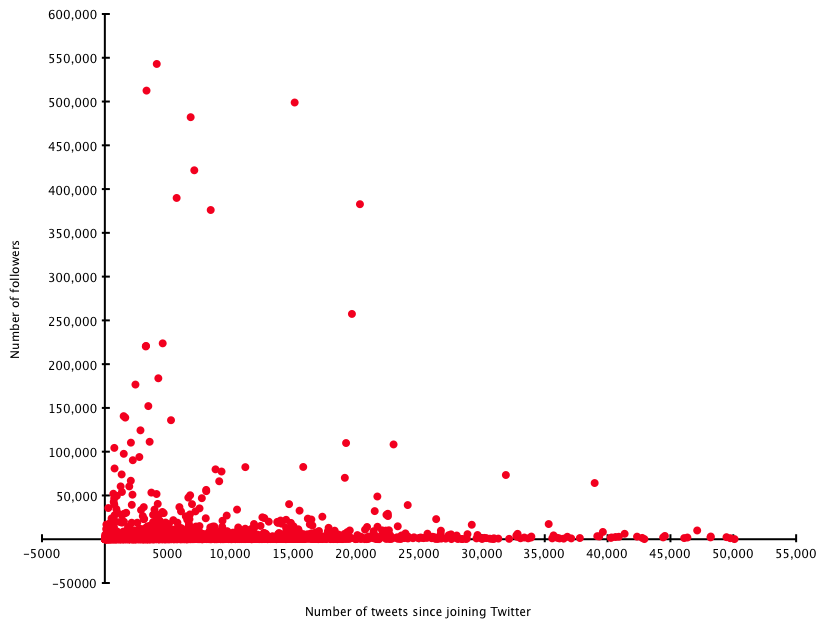
Tweets

Tweets/followers
Tweets/followers

This doesn’t seem to show much, either. What might be helpful is to measure this against time…

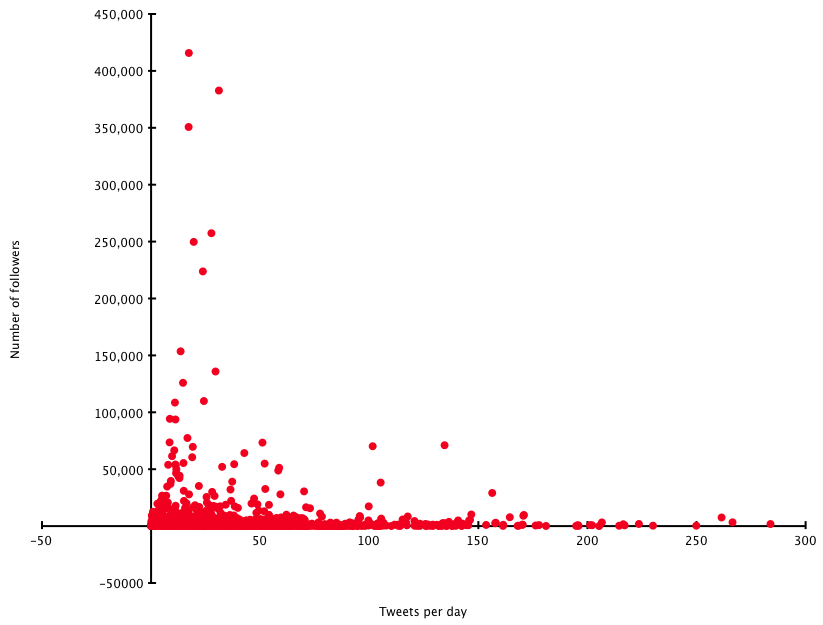
Rate

Tweet rate/followers

When you measure the average number of tweets per day (since joining Twitter, and I’ve ignored a handful of rates over 300/day), a broad message comes across that you’re best of tweeting up to around 30 times a day – above that, and you risk putting people off. Again, this isn’t exactly surprising.

So there aren’t really any profound observations here, sorry: the data seems to corroborate common sense.

In the third and final part of this series, next week, I’ll see if there are any correlations between tweeting style (as recorded by Twanalyst – number of retweets, posting of links, how much you reply to other people etc) and follower counts. Thanks for listening!

PS: I’m indebted to the UNIX BASH Scripting blog for an awk script that helped crunch this data.

What gets you Twitter followers? Part 1: profile usage

Running Twanalyst has given me access to large amounts of data, which I’m slightly-too-addicted to crunching. Inspired by this post at Social Media Today, which analyses the popularity of Twitter users according to the words they use in their tweets, I realised I have a large database of people’s Twitter biographies. Do the words people use in their self-penned descriptions have any influence on the number of people who follow them? (Well, presumably yes, given that ‘sod off and don’t follow me’ would be an ill-advised way of getting a large following.) But which words?

I’ll come back to that – first, some more general data.

I analysed around 50000 accounts with data stored at Twanalyst. The average number of followers was 1449. Some gleanings:

  • 66% of people gave a URL with their Twitter biography – they averaged 1984 followers, whereas those who didn’t give a URL averaged only 429
  • 50% of people use a background picture of some kind – they averaged 2196 followers, whereas those who didn’t use one averaged only 707 (more on the pictures in a moment)
  • 97% of people use an avatar (ie little icon) with their Twitter account – they average 1485 followers, whereas those who don’t average just 144
  • 80% of people provided a biography or description – they averaged 1541 followers, whereas those who didn’t averaged 183.

Of those who use a background picture, by the way, the most popular ones of those provided by Twitter are themes 1,2,5,9 and 10 (all with > 1000 users – 1 has > 10000) – but only theme 15 took the follower count above average, and that’s probably just because the Hollywood actor Neil Patrick Harris (with around 130,000 followers) uses it! (I haven’t mined whether using your own background picture is better than using one provided by Twitter, though the above data implies that.)

Back to the words.

I got rid of stop words, then mined the biographies for words (mostly nouns, plus a few selected adjectives) which describe someone’s role in life (whether career-based, such as ‘programmer’, or personal such as ‘wife’). The top 10 words (by popularity) were: geek, writer, student, developer, lover, father/dad, mother/mom, blogger, photographer and designer. I only looked at words used by 1% of by sample set or more.

The only words in the top 50 or so terms associated with above average follower counts were: blogger (2323 – remember the average was 1449), artist (1692), girl (1711), fan (1712), author (3681), entrepreneur (2663), director (1683), marketer (2541), expert (4273) and singer (2300). Some more details picked out (all figures are average number of followers where the description uses the term in question):

  • The worst terms (all with follower averages below 400) were student, developer, nerd, engineer and programmer – go figure! (Geek came in at 675, so also pretty low.)
  • Home life and gender: father/dad gets 845, but mother/mom gets 1202; girl gets 1711 but boy only 518; husband gets 868, wife 740; oddly the generic guy gets 1380.
  • Expertise: amateur gets 477, expert gets 4273 (but professional only has 969)
  • Although author gets 3681, writer gets only 906 – maybe people see ‘author’ as more established, and writer as more wannabe? (Editor fares averagely with 1409.)
  • Although singer gets 2300, musician only gets 585.

I can’t claim using the right words is a guarantee of a high follower count, of course – that must relate to what you write as well as who you are; but there do seem to be some general trends (eg expertise rates high, and nobody wants to read what students have to say!). Oh, and if you use the phrase follow me in your bio, the average follower count is 2418…

Another time I’ll mine some data about how people’s Twitter behaviour (eg how much they follow others, how often they tweet, what sort of tweets they write…) relates to follower counts too. Watch out for Part 2 some time in the next few weeks. If I find any more time (ha!) I might create a tool where you can look up terms yourself.

(Oh, and you can follow me at @hatmandu, of course!)

Edit (Part 1A!)

Here’s another angle on the same data set. Out of 39975 profiles which include descriptions, we find the following:

  • 1.5% have 10,000 or more followers. The top 10 ‘role-defining’ terms people in this subset use are: blogger (4.6%) author founder speaker writer entrepreneur host father/dad director marketer (2.2%)
  • 10.0% have 1,000 or more followers but less than 10,000. The top 10 terms here are: blogger (7.7%) writer geek father/dad entrepreneur author designer lover mother/mom founder (3.0%)
  • 44.2% have 100 or more followers but less than 1,000. The top 10 terms are: geek (5.7%) writer blogger designer student lover developer father/dad mother/mom photographer (2.7%)
  • 44.3% have less than 100 followers. The top 10 terms are: student (2.7%) geek writer designer developer lover guy fan mother/mom photographer (0.8%).

It’s noticeable that writer appears at all levels – from the hugely successful to the obscure and aspiring, just like in real life. It’s hard not to spot that the very top end accounts are full of founders and speakers etc. And the bottom: those pesky students again. I’m surprised blogger fares so well – but perhaps people like bloggers who write about a specialist subject?

Part II next week!

What’s it all about, Alfie

I’ve just launched a new tool at Hatmandu.net, a text content and keyword analyser – in theory useful for search engine optimisation, but also to get the general gist of a text.From the notes:

This text content and keyword analyser is intended to give a more precise indication of a text’s most important words than other tools available. Most keyword analysers use simple word frequency (which is also shown here anyway), but that doesn’t relate the specific text to the language in general – common terms such as ‘people’ and ‘time’, for example, appear in many documents, but do not necessarily indicate the essence of the particular text being analysed. This analyser uses the TF-IDF statistical method to relate the frequencies of words in the specific text to their general frequencies in the British National Corpus. I am indebted to Adam Kilgarriff‘s version of the BNC, which I have adapted considerably for this tool. This analyser mainly uses the nouns in the BNC, on the basis that these are the parts of speech that best indicate the subject matter of a text. (At some point I hope to produce a version using an American English corpus, though I’d be surprised if the results were very different.)

It works with Twitter accounts (though it only reads the last 200 tweets, which may not form a usefully large body of text), and URLs where my humble scraping tool is able to extract the text successfully – most useful is the ‘paste text’ field, which will accept up to 1Mb of text (about 200,000 words) – so will analyse entire books if desired. Livejournal users can enter their URL (http://username.livejournal.com) assuming their account is public.

It’s a bit experimental at the moment, but hopefully might migrate from ‘possibly fun’ to ‘possibly useful’ in due course!

The narrative of illness

So, yesterday I was felled by illness. The night before, I lay wake hour after hour, aching and uncomfortable with stomach pangs. As the day went on, I felt worse, with hot and cold flushes, more pangs, total exhaustion, and I crept back into my bed for much of the day for further fretful sleeplessness. Even one of usual salves – watching one of the Peter Sellers Pink Panther movies – failed, as I just couldn’t concentrate. Inevitably, feverish thoughts roved to whether I had the dreaded swine flu.

Today, the day began with some queasiness, but as time has gone on I feel immeasurably better – I’m chipper, punning and have a renewed bounce in my step. Whatever battle my body was fighting, it reached some low points but it eventually won.

Which is what made me think of the parallel with narrative. Kurt Vonnegut said all stories boil down to ‘Man in a hole’: “Somebody gets into trouble and gets out of it. People never get tired of this.” Legions of Hollywood screenwriters (eg Blake Snyder, whose Save the Cat! book is quite interesting – and I’ve only just discovered he died a few weeks ago; or Christopher Vogler, who applies Joseph Campbell’s ‘hero’s journey’ analysis of myth to blockbuster movies) have made a career out of amplifying Vonnegut’s summary into detailed scene plans for film scripts. Everyone knows there are only three, seven, 20 or 36 plots (or eight, nine, 37, 69…) – or just one, really.

All of life is full of these little mini-dramas, overcoming challenges, confronting enemies, battling illness. It’s no bloody wonder we like stories so much – especially the ones where we win.

A new look at the publisher’s lunch

As usual, everyone’s talking about how publishing can survive, and how to make money on the internet. Paul Graham has written an excellent essay, Post-Medium Publishing, where he observes that it is wrong to think publishers sell ‘content’ – rather, they sell a means of distribution, and prices are dictated by that (ie, historically, the price of paper and printing) – if t’were otherwise, we’d all pay vastly different sums depending on the quality of the content. And we don’t. Bottom line: “Whoever controls the device sets the terms.” Prospect Magazine, commenting on Graham, also reminds us that we’ve seen all this before, back in Shakespeare’s time.

Meanwhile, Steve Outing warns that ‘Your news content is worth zero to digital consumers’, and that money is again in delivery systems such as neato iPhone apps. (He quaintly goes on to suggest micro-rewards – tip jars 2.0, I guess.) Jeff Reifman has weighed in against Outing saying ‘Micropayments could save journalism’. It’s hard to see how: if the headline writers are any good, the headline is where the news is – the rest is elaboration. I get my news from a few simple sources, all of them essentially ‘headlines’:

  • A few snatched moment’s of Radio 4’s Today programme between bouts of baby care – I really just get the 7am headlines
  • RSS feeds from the BBC and the Guardian on my iGoogle page – I’ll occasionally click through if I want the detail or I’m piqued by something
  • Twitter feeds

I buy one newspaper a week: the Saturday Guardian. I do read the news in it – but almost invariably I’ve seen it the day before on the web. I like it for the columnists, the features, the magazine, basically as a ritual entertainment to accompany a cup of tea. My wife just does the crossword. The physical newspaper, in other words, has become an entertainment channel rather than a news one.

Micropayments? I can’t see myself paying for news stories. Features… maybe, if they’re really going to interest me. Academic papers: possibly, if I’m researching something. That said, I did make one micropayment this week: we were planning to buy a new car seat for the baby, and only one place, Which, has a decent, up-to-date review of best buys, focusing on safety (ie there’s an emotive imperative here – and the possibility of saving money, I guess). They charge £1 for a trial subscription – but then sting you with monthly payments several times that. You can cancel any time, so I will cancel straight away. It’s very annoying: I just want one article, which I probably would have paid £5 for, simply because it’s not possible to get this quality information elsewhere. I subscribed because I’m bloody minded enough to remember to unsubscribe – though of course their business model partly relies on people forgetting, or being sufficiently charmed by the dull magazine you get in the mail.

Paul Graham says that the only kind of information people will pay for is that “they think they can make money from” – I’d add that saving money (assuming more is saved than the information costs!) might be a motive, and niche issues such as the baby safety report I mentioned.

Graham reminds us, as people like Chris Anderson have done before, that something else people will pay for is live entertainment. I wonder if this connects to another constraint upon pricing for publishing models: it’s noticeable that novels, DVD rentals, cinema visits, CD albums, all generally fall within the £5 to £15 range: people will only pay so much for entertainment that they know can be reproduced. Live entertainment, such as a theatre show, opera, music gigs and a decent meal at a good restaurant, is more of a one-off experience, and commands more value. In his excellent book 59 Seconds, Richard Wiseman points to research showing that people’s happiness is improved significantly more by experiences than by products. There’s no such thing as retail therapy.

Again and again I come back, too, to the feeling that modern content producers – writers in particular – have unrealistic expectations of fame and fortune. Most people don’t want their content, and won’t pay much for it even if they do. As Prospect says, we’ve gone back to a pre-Romantic time (I’m thinking of poets and gentleman publishers such as John Murray here, which is where the modern author-publisher dream of the last 200 years began) where writers have to work hard, diversify, hawk their products themselves, and not just sit back and expect a publisher (whose grip of the medium is now somewhat buttery) to make them millions. The Dan Browns and J K Rowlings are the lucky exceptions.

I’m a writer myself, so it’s not like I don’t have an interest in these issues – but I just write to commission, content I know someone seems to want, rather than trying to sell my own ideas, as the latter is so much hard work (obviously I thank my stars for those commissions – and make most of my money by doing design work anyway – ie making vessels for others’ content). Whatever ideas I have (mostly daft, I admit) I give away for free, often at this website.

Perhaps the answer lies in Kevin Kelly’s 1000 True Fans argument: build a core, devoted audience – if your stuff is good enough (and has a bit of luck and a fair wind), there will be some people at least who will go to your every gig, buy every T-shirt, read every book. If you can’t find 1000 true fans… maybe it’s time to be honest and admit the world isn’t knocking at your door. Do something for free. See what happens. Oh, and go out for a nice meal: it will make you happy.

Edit: After a challenge on Twitter to crowdsource payment for an article, you can now pay micropayments to get me to write an article on ‘The Modern Ninja’! I can’t lose: if not enough money is raised, it proves content isn’t worth much to people (well, er, my content…); if it is, I get a paid commission! (Oh, and if less than $300 is raised, I’ll refund your money folks!)
Dissenters: L

Levellers

Strictly speaking the 17th century Levellers were a political rather than a religious movement per se, but they deserve mention for their influence and their nonconformist connections.

Their nickname – applied by their enemies, possibly even by Charles I himself – came about from their belief in ‘levelling’ all strata of society, and that all men are equal in God’s sight, or possibly through origins in rebel rural hedge levelling.

As well as numerous social reforms, they campaigned for the separation of Church and state.

They began as natural allies of Oliver Cromwell, many of them members of his New Model Army, but a dispute over back pay for soldiers (and a general disaffection with Cromwell’s authoritarianism) led to rebellion – this was quashed when Cromwell executed three Levellers at Burford, Oxfordshire in 1649.

The citizens of Burford remember the event to this day – see www.levellers.org.uk. Pamphleteer John Lilburne was a prominent founder of the movement – he later became a Quaker.

Liberal Catholic Church

The Liberal Catholic Church www.liberalcatholicchurch.org was effectively founded in the 1910s by James Wedgwood of the renowned china-producing family.

He was ordained into the Old Catholic Church, a German group which split off from Roman Catholicism in the 1970s through a rejection of papal infallibility, and later spread to England.

The life of Christ is the guiding principle of Liberal Catholicism, which also holds that Christ practised certain rites of ‘mysteries’ of the East – thus the movement was closely allied to the mystical theosophy movement of Madam Blavatsky and Charles Leadbeater.

Liberal Catholics, who are found worldwide, maintain there is a common unity and purpose to all religions – though this didn’t stop their own schism in 2003 over the ordination of women, and two movements now use the Liberal Catholic Church name.

Lollards

The Lollards also blurred boundaries between politics and religion, but with a more specific theological underpinning thanks to their founder John Wycliffe (1320s-1384).

Wycliffe was a theologian who criticised the Church for its corruption, disputed the divine authority of Church leaders, and famously laboured to produce the first English vernacular edition of the Bible.

He even questioned transubstantiation. He was a respected Oxford don, after his death his books were burnt, and although Lollardy persisted in pockets into the 16th century, his followers were persecuted.

The etymology of the Lollard name is disputed, possibly meaning ‘mumbler’ or ‘idler’, but the term more generally came to mean ‘heretic’. The Lollards had no central doctrine, but their anticlerical stance was an early herald of the Reformation.

London Missionary Society

The LMS was founded as the Missionary Society in 1795, then renamed in 1818, with a focus on evangelical missions to Africa and the Pacific islands.

It was non-denominational, Congregationalist (see earlier in this series) in tone and supported by evangelical clergy from both Anglican and Nonconformist churches.

Its first voyage was on The Duff, to Tahiti, where its 17 missionaries received a hostile reception; and on a return voyage the society was financially devastated by The Duff’s capture by French privateers.

In the 1830s and 1840s the LMS was more successful, apart from when missionary John Williams was eaten by cannibals in the New Hebrides.

The society disbanded in the 1970s but was absorbed into what is now the Council for World Mission.

Dissenters: G, H & I

Grindletonians

(also see Familists)
The Grindletonians were yet another small dissenting group of the mid-17th century, this time named after a place rather than a person, namely Grindleton in what was Yorkshire and is now Lancashire.

They were founded around 1610 and were active in the area until the 1660s. Grindleton is below Pendle Hill, associated with Quaker founder George Fox, who may have been influenced by the Grindletonians’ leading light, Roger Brearley.

His preaching embraced antinomianism (a rather hasty summary of which would be “you’re saved, so you can do what you like”) and the earthly paradise, and he was against the organised Church and its sacraments. Other Grindletonians included John Webster and Robert Towne.

Inghamites

The Inghamites also hailed from Yorkshire and Lancashire. Their founder was Benjamin Ingham (1712-72), an Ossett-born and Oxford-educated preacher who had accompanied the Wesley brothers to the USA in the 1730s.

On his return, he was banned from preaching in churches, and established his own Inghamite Methodists, split off from the Moravian Methodists – within 20 years there were more than 80 congregations, a few fragments of which persist to this day in Yorkshire, Lancashire and Cumbria. Ingham often preached in homes and fields, and emphasised devotion and responsibility to the laity.

When Ingham disagreed with the curate of Ossett, a Rev Godly, he wrote to John Wesley: “I have just been talking to Mr. Godly. You know, I believe he has been misnamed.”

The majority of Inghamite groups broke up from the 1760s, when Ingham himself was influenced by the Sandemanians (see later in this series), and some were absorbed into the Scottish Daleites in the early 19th century.

Various early Inghamite registers are held by The National Archives. A small Inghamite congregation was even founded in Canada and continues today – see www.farringdonchurch.ca.

Irvingites

Edward Irving (1792-1834) was a Scottish minister from Annandale who is regarded by many as the main figure behind the Catholic Apostolic Church – but not by its members themselves, who see him as more of a John the Baptist figure.

Various miracles such as prophecies, healings and speaking in tongues were believed to have taken place during Irving’s ministry in London, and the group focus on such acts of the Holy Spirit through formalised rituals of their own, under the guidance of 12 Apostles who are ‘called’ rather than ordained.

Irving was influenced by some of the poet Coleridge’s more mystical philosophies, and in 1833 was deposed from the Church of Scotland on the grounds of heresy.

The two main Irvingite or Catholic Apostolic congregations surviving in Britain are in Surrey (where Henry Drummond, a more important figure to the group than Irving himself, lived) and London, and there are others in America and across Europe – but no new Apostles have appeared since the last died in 1901.